 TankOdds
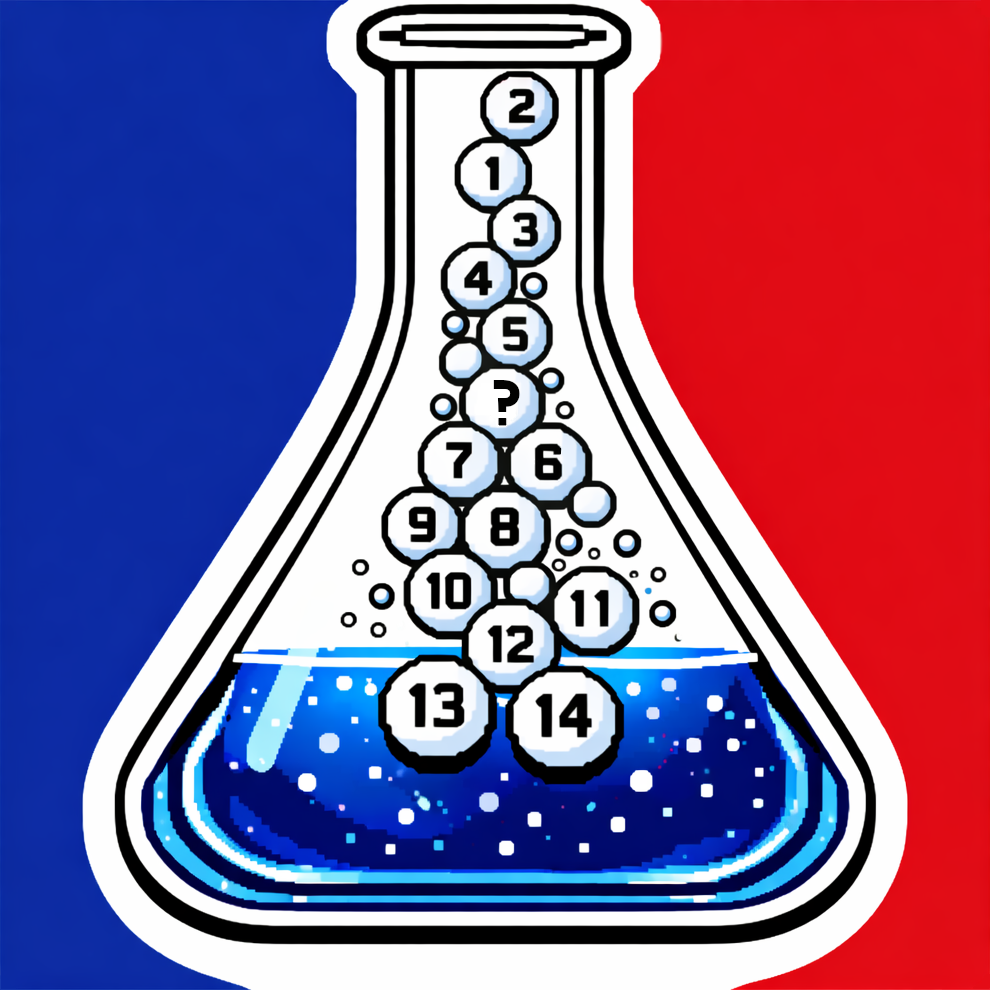
How the NBA Draft Lottery Simulator Works
How are NBA Draft Lottery odds calculated?
The NBA gives each of the 14 lottery teams a share of 1,000 numbered combinations, weighted by reverse regular-season record. The worst team gets 140 combinations. The best lottery team gets 5. Four picks are drawn by lottery. After that, picks 5 through 14 fall into reverse record order. The worst team's Top 4 odds are 52.1%, and its odds at the first pick are 14.0%.
TankOdds uses those same combination weights in every run. The odds shown in the standings table come straight from the NBA's published lottery table. They are fixed inputs, not simulated outputs.
How does TankOdds simulate NBA Draft Lottery outcomes using Monte Carlo?
Monte Carlo simulation just means running the lottery over and over and counting what happens. Each TankOdds simulation runs one full lottery drawing using the official NBA combination weights, records where the donor team's pick landed, and then moves to the next trial. As the run gets larger, the estimates settle down. TankOdds can run up to 1,000 trials in one session.
What does the Draft Pick Distribution show?
The histogram shows where the pick landed across all completed simulations. Each bar is one draft position. The decimal below it is the share of simulations that landed there. If the pick stays with the donor team, the bar uses the donor color. If it conveys, it uses the recipient color. If the two colors are too close, the site swaps in gray and green so the chart stays readable.
A tight cluster means the outcome range is narrow. A wide spread means the result is swingier.
What does the Simulation Outcome Strip show?
Each simulation result shows up as a thin vertical rectangle. If the pick conveys, it uses the recipient color. If it stays, it uses the donor color. Over time the strip turns into a quick visual read on the whole run. A strip dominated by the recipient color means high conveyance odds. A mixed strip means the outcome is closer.
How does streaming conveyance probability work?
The streaming probability chart shows a smoothed version of the running conveyance estimate. Recent trials matter more than older ones, so the line stays readable without turning into static. It's there to help you see the trend of the run, not every tiny wiggle.
What is Lottery Seed Movement and why does it matter?
Seed Movement adds a random adjustment to the donor team's lottery position before each draw. Small moves are much more common than large ones. The point is to model late-season uncertainty instead of pretending the current seed is locked in forever.
Simulation Controls
Run starts the simulation. Stop cuts it off. Lottery Seed sets the donor team's projected position from 1 through 14. Protected picks go in the Protected Picks field using interval notation like 1-4 or 1-4,10-14. Clicking a standings row fills those fields automatically, but you can edit them by hand if you want to test a specific scenario.
Simulation Totals and Conveyance Probability
The Simulations and Prob to Convey counters show the running totals from completed trials. With enough volume, the conveyance estimate gets close to the long-run probability under the current seed and protection settings.
How Today's NBA Games works
The Today's NBA Games page pulls the live NBA scoreboard and visible odds row from ESPN. Each card shows the current spread, total, and moneyline, then lets you run a 50,000-trial simulation in the browser for that matchup. The model uses the spread and total to set expected scores, then draws each game in two layers. First it draws a shared game script that affects both teams together. Then it adds each team's own scoring variance from this season. It also uses the head-to-head series record, both the regular season and the current playoff series standing, to apply a small shift to the expected margin.
The edge row compares the model's win probability to the win probability implied by the spread. Green marks a stronger model edge at 5 percent or more. Amber marks a smaller lean at 3 to 4 percent. Gray means the model is close to the market baseline.
How the DraftKings line tracker works
Some Today's NBA Games cards show a Line Move row at the bottom. The visible odds row on the card comes from ESPN, but the separate Line Move row uses stored DraftKings snapshots to track how the market changed from the opening number to the current number. It only appears once the tracker has at least two snapshots to compare, so a line posted shortly before tip may not show it yet.
If the spread did not move, the row shows the current spread with "(stable)" next to it. If the spread moved, it shows the spread change as a delta such as -2.0 or +1.5. If the total moved, the O/U shows as a delta such as +1.0 or -0.5, since the full current total is already visible on the main odds line.
Line movement shows where the market changed since open. Sharp money, public betting, and injury or lineup news can all move a line. A move is a signal that the market changed, not proof by itself that one side is the right bet.
How the NCAA Champion Probability Simulator Works
The NCAA Champion Probability Simulator runs Monte Carlo simulation from the 2026 Final Four through the title game. It shows a distribution over the four remaining teams instead of one fake-definitive winner.
Championship Odds as a Probability Foundation
Each team starts with a base probability derived from its opening Final Four title odds from March 29, 2026. Those American odds are converted into implied probabilities and used as a team-strength signal.
They are still title-market prices, not literal semifinal odds, so the simulator does not treat them like one-game probabilities. It compares the two teams directly in each matchup instead.
Win Probability and the Upset Factor
When two teams meet, the simulator compares their implied title probabilities directly. If Team A has probability pA and Team B has probability pB, Team A gets pA / (pA + pB).
The Upset Factor slider pushes that number back toward 50/50. At zero percent, the model follows the market baseline. At one hundred percent, every game is a coin flip. The default is 10 percent.
Final Four Simulation
Each simulation runs the final three games left in the tournament: the two semifinals and the title game. One semifinal result changes the championship matchup, so the likely finalists still shift from trial to trial.
The simulator runs 1,000 trials per session. Each trial produces one champion. The final distribution shows how often each team won under that setup.
Champion Probability Bar Chart
The horizontal bar chart shows the simulated title probability for the four remaining teams, sorted from least likely to most likely. The percentage at the end of each bar is the share of completed simulations that team won. Early in a run the bars move around more. By 1,000 trials they settle down enough to be useful.
Simulation Outcome Strip
The outcome strip shows every completed simulation as a thin vertical column colored by the winning team. If one team dominates the run, you see long bands of that color. If the results are spread out, the strip looks more mixed. Teams that never win a simulation in that run do not show up in the key.
How the NBA Playoff Bracket Simulator Works
The NBA Playoff Bracket Simulator pulls live conference standings from the ESPN API and uses DraftKings Sportsbook championship odds to simulate the full 2026 NBA Playoffs, including the play-in tournament. Those standings determine the seeds, while the title market provides the strength signal for each best-of-7 series.
Live Standings and Seeding
Conference standings are fetched from the ESPN API each time the page loads, so the bracket always starts from the current regular-season order. Before the play-in is settled, the simulator fills the 10 slots in each conference from those live standings and leaves the play-in path open. Once the real first-round field is confirmed, the bracket uses that finalized 16-team playoff field and the verified play-in results tied to it. No manual seed entry is required.
Championship Odds and Win Probability
Each team enters the simulation with a base probability derived from its current DraftKings championship odds. American odds are converted to implied probability using the standard formula, then any head-to-head series is rated by comparing the two teams' implied championship probabilities directly. In other words, if Team A has implied title probability pA and Team B has implied title probability pB, the base chance of Team A winning the series is pA / (pA + pB).
This keeps the model tied to the live title market instead of falling back to seeding alone. If a team is missing from the championship-odds table, the simulator uses seed-based fallback logic only for that matchup. The Upset Factor blends the base series probability toward 50/50. The slider defaults to 20 percent, adding a moderate dose of variance while keeping the model anchored to the title market.
Play-In Tournament
Seeds 7 and 8 in each conference are earned through the play-in tournament, which runs in April before the main bracket opens. The simulator includes the full play-in field for both conferences below the main bracket. Game A (#7 vs #8): the winner locks in the #7 seed. The loser falls to Game C. Game B (#9 vs #10): the winner advances to Game C. The loser is eliminated. Game C (loser of Game A vs winner of Game B): the winner earns the #8 seed and enters the first round against the #1 seed. Before those games are settled, the bracket treats them as live play-in slots. After the field is finalized, Reset Sim restores the verified play-in results for that season.
Round Structure
After the play-in, 16 teams advance, with 8 per conference seeded 1 through 8. The first round pairs 1v8, 2v7, 3v6, and 4v5 in each conference across 8 best-of-7 series. Conference semifinals reduce each conference to two teams across 4 series. Conference finals produce one champion per conference. The NBA Finals is a best-of-7 between the West and East champions. Home-court advantage belongs to the higher seed in every round. The simulator resolves each round in sequence, advancing winners and locking in results before moving to the next stage.
Simulation Controls
Any individual matchup can be simulated by clicking it to open the series popup and selecting Simulate This Series. The slot machine animation resolves the series before the result locks in and dependent matchups unlock. Simulate All runs every available game from the earliest unlocked round forward, completing the entire bracket automatically. Reset Sim clears all simulated results while keeping live standings and seeds in place, allowing a fresh run with the same or adjusted Upset Factor. The Upset Factor slider (0 to 100 percent, default 20 percent) controls how much the underlying title-market edge is blended back toward random chance. On desktop, scroll to zoom the bracket and drag to pan; on mobile, pinch to zoom and drag to pan. Reset View returns the bracket to its default full view.
Export Options
The Export dropdown provides four options: Print opens a clean print layout with no controls or dark background. Save HD PNG downloads a high-resolution image of the full bracket suitable for sharing. Copy Image to Clipboard puts the bracket on the system clipboard for pasting into messages or social posts. Copy Image and Post to X copies the image and opens X with a pre-filled link. The bracket can be exported at any stage of simulation, whether it is partially or fully completed.
How the Lottery Forecast Works
The Lottery Forecast runs a full-lottery simulation that models all 14 NBA Draft Lottery picks at once. Unlike the Team Pick Sim, which focuses on one team's seed and one pick, the Lottery Forecast builds the full lottery field, applies current protection rules, and produces a projected order for every lottery team in a single pass.
Full-Lottery Simulation
Each simulation draws all four lottery picks in sequence using the official NBA combination weights. Seeds 1 through 3 get 140 combinations each. Seed 14 gets 5, out of 1,000 total, based on the NBA's published lottery rules. The four lottery winners are drawn without replacement, so winning the first pick removes a team from consideration for picks 2 through 4. The remaining ten teams fill picks 5 through 14 in seed order. The result of each simulation is a complete 14-pick order with one team in every draft slot.
Before the playoff field is finalized, the app uses current ESPN standings as a projection of the 14 lottery seeds. After the play-in is complete, it switches to the real lottery field by excluding the 16 confirmed playoff teams. Known 2026 first-round conveyance rules are then mapped onto that field before the run begins. Users can choose how many runs to perform, from 1 to 100, and the current default is 20.
Projected Pick Order Chart
The vertical bar chart shows one bar per pick slot (1 through 14). Each bar represents the projected team for that slot based on the observed full lottery orders in the current run. Bar height is the number of times that exact team-slot pairing occurred in the sample, not a site-wide fixed probability. Bars use each team's primary color, with similar colors shifted when needed so all 14 bars stay readable.
The projection stays tied to complete observed lottery orders instead of stitching together 14 separate slot leaders. That keeps impossible combinations off the page and makes sure every displayed team-slot pairing came from a lottery order that actually happened in the run. Early picks stay volatile because several teams have similar top-lottery odds. Later picks get more stable once the four lottery winners are removed and seed order takes over.
Mock Draft
Once the forecast completes, the projected team order populates a draft board with 14 empty pick slots. Clicking Generate Lottery Draft runs a mock draft that assigns one 2026 prospect to each pick using a weighted scoring system instead of a probability simulator.
The board balances three inputs stored in the current app logic: TankOdds prospect rankings, editorial team-need weights, and recurring player-team fit ratings gathered from current expert mock drafts. At the top of the board, prospect rank still dominates. As the lottery moves deeper, team need and fit carry more weight, which makes the later picks behave more like a real front-office board.
Each generation also adds controlled variation to the scoring. Picks 1 through 3 get only a tiny amount of noise, so the top of the board is nearly locked in. Picks 4 through 7 get a moderate amount, and picks 8 through 14 get the most movement, which lets the later lottery shift by a few spots the way real mock drafts do. That keeps repeated runs from producing an identical board while still holding the top talent in place.
Once the official NBA lottery results are announced, TankOdds can load that real lottery order directly so the board reflects the true post-lottery draft setup instead of a simulated projection.
Players are revealed pick by pick with a short pause between each selection so the draft board fills in the way an actual draft room plays out. Teams marked with an asterisk (*) have picks that may convey if they fall outside protection, while double asterisks (**) indicate the current projected slot already sends the pick to the recipient shown.
NBA Standings
The NBA Standings page pulls live data from the ESPN API each time it loads and presents all 30 teams sorted best to worst by win percentage. Two views are available: Conference and Overall. Conference view stacks Western Conference standings and Eastern Conference standings in a single table, which makes playoff seeding, the play-in field, and the lottery line easy to scan without switching pages. Overall view combines all 30 teams into one league-wide order.
The direct-playoff cutoff is highlighted in Conference view with a dotted separator line between seed 6 and seed 7. Seeds 1 through 6 advance directly to the playoffs, while seeds 7 through 10 enter the NBA play-in tournament. That visual break marks the cleanest split in the conference race. It does not lock the final lottery field by itself, because two play-in teams miss the playoffs every year and drop back into the lottery picture.
The table columns extend well beyond a standard standings line. In addition to wins, losses, win percentage, games behind, home record, and road record, the page shows last ten games, current streak, points per game, opponent points per game, and point differential. Point differential is color-coded green for positive and red for negative values because it is one of the strongest regular-season indicators of underlying team quality. Home and road records matter because home-court advantage in the NBA Playoff Bracket flows directly from the regular-season standings shown here.
Games behind is handled differently in the two views. Conference view uses ESPN's conference-specific games-behind value. Overall view recalculates games behind relative to the team with the best record in the entire NBA, which creates a true league-wide measure instead of a conference-only one. Clinch markers from ESPN are normalized into a smaller set of badges: z for division clinch, y for conference clinch, x for playoff berth, p for play-in clinch, and e for eliminated. Eliminated rows are dimmed so the active race is easier to scan.
Hit or Brick
Hit or Brick uses a 52-card deck built from NBA legends and current stars, but it plays by blackjack rules. Each player is assigned a rank from 2 through Ace. Aces count as 11 unless they need to drop to 1. Kings, Queens, Jacks, and Tens are worth 10. Numbered cards keep their rank.
You and the dealer each get two cards. One dealer card stays hidden until you stand. If you open with blackjack, the hand resolves right away. If not, you decide whether to hit or stand, and the dealer draws to 17. The stats shown on each card are there for context. The game score comes from the rank, not from adding the stats together.
How is TankOdds different from other NBA draft lottery simulators?
Most NBA draft lottery tools run a single lottery spin and show one outcome. TankOdds runs up to 1,000 independent simulations per session and displays the full probability distribution: how often each pick position showed up across all trials. That gives you the real range of outcomes and how tightly or loosely packed they are.
TankOdds also resolves pick protection rules before each simulation draws. That means every simulated outcome respects the current protection structure, and impossible lottery results don't show up in the distribution. The weighting system follows the NBA's official lottery rules and uses the same published probability table that determines real draft positioning.
By: Oren Fugon
Last updated: May 3, 2026
Sources: TankOdds methodology, published league lottery odds, public standings data, and sportsbook market inputs where noted on the page. See Editorial Policy and Data Sources.