 TankOdds
Stop rolling. Start seeing the numbers.
Our NBA Draft Lottery odds simulator and probability calculator harnesses the statistical power of Monte Carlo modeling to run 1,000 trials in real time.
Unlike most tools generating a single random outcome from published odds, TankOdds lets you view accumulated results for each draft position and how protections affect whether a pick conveys, all displayed in easy-to-read graphs.
Click a lottery team row to explore its draft projections.
The lottery standings table is interactive. Move to a team row and press Enter or Space to open that team's simulator in a new tab.
| # | Team | W | L | Win% | GB | Top 4 | #1 OVR | Recipient | Protection |
|---|---|---|---|---|---|---|---|---|---|
| 1 |

|
17 | 65 | 0.207 | 43 | 52.1% | 14.0% |

|
1-8 |
| 2 |

|
19 | 63 | 0.232 | 41 | 52.1% | 14.0% |

|
1-4,10-30 |
| 3 |

|
20 | 62 | 0.244 | 40 | 52.1% | 14.0% | ||
| 4 |

|
22 | 60 | 0.268 | 42 | 48.1% | 12.5% | ||
| 5 |

|
22 | 60 | 0.268 | 42 | 42.1% | 10.5% |

|
1-8 |
| 6 |

|
25 | 57 | 0.305 | 39 | 37.2% | 9.0% | ||
| 7 |

|
26 | 56 | 0.317 | 38 | 31.9% | 7.5% |

|
|
| 8 |

|
26 | 56 | 0.317 | 38 | 26.2% | 6.0% | ||
| 9 |

|
31 | 51 | 0.378 | 29 | 20.2% | 4.5% | ||
| 10 |

|
32 | 50 | 0.390 | 28 | 13.9% | 3.0% | ||
| 11 |

|
37 | 45 | 0.451 | 27 | 9.4% | 2.0% | ||
| 12 |

|
42 | 40 | 0.512 | 22 | 7.2% | 1.5% |
|
1-14 |
| 13 |
|
42 | 40 | 0.512 | 22 | 4.7% | 1.0% |
|
|
| 14 |

|
43 | 39 | 0.524 | 17 | 2.4% | 0.5% |
|
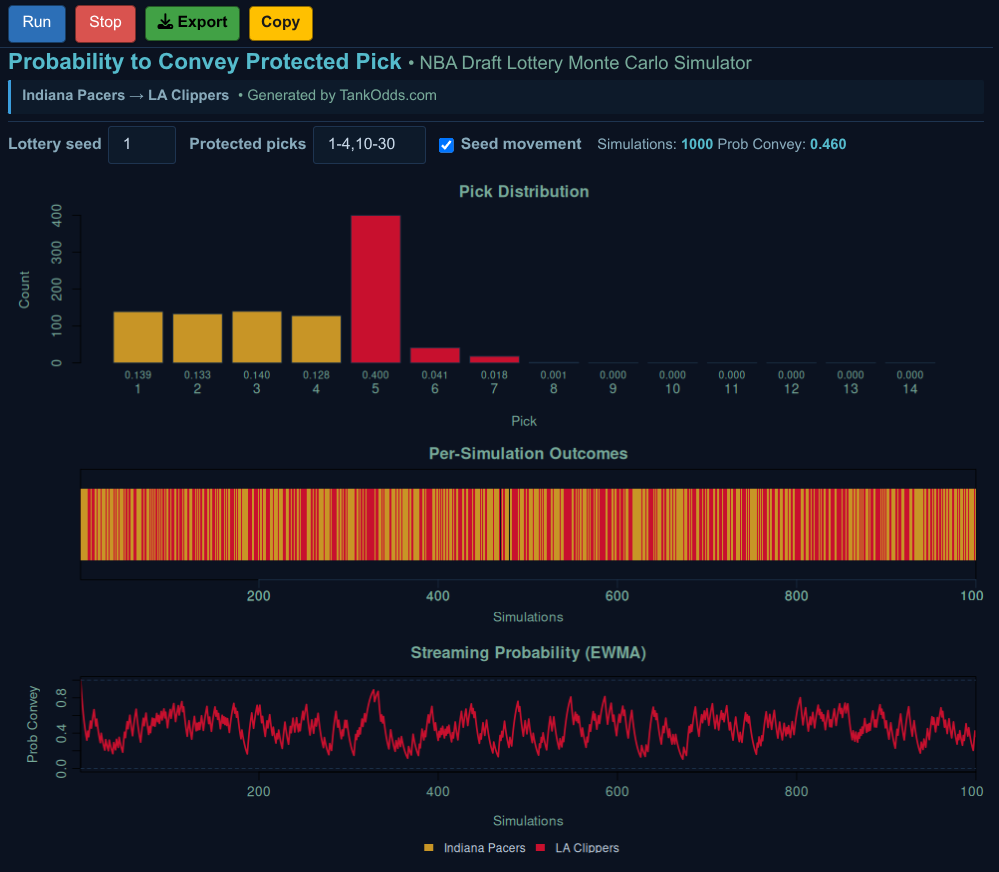
Pick Distribution Histogram
Accumulated pick outcomes across all draft positions, visualized as a probability landscape across 1,000 trials.
Probability to Convey
Protection rule resolution: likelihood a pick transfers given lottery outcomes.
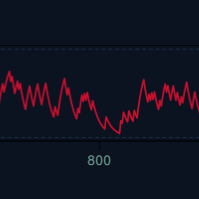
Streaming Probability (EWMA)
Exponentially weighted moving average tracking simulation convergence in real time as trials accumulate.
2026 NBA Draft Lottery Odds by Team
The standings table above shows each lottery team's Top 4 probability and first overall pick probability from the NBA's published lottery table for the current 14 seed order. Those odds are fixed by seed. The worst lottery team gets 140 combinations out of 1,000, while the 14th seed gets 5. TankOdds uses the league's published weights for each seed, so the percentages in the table are fixed inputs and not simulated outputs.
Before the playoff field is finalized, the page treats the lottery race as a standings-based projection. Once the play-in is over and the real 16-team playoff field is confirmed, the table switches to the true lottery field by removing those playoff teams. Click any team row to run 1,000 Monte Carlo simulations for that seed and pick-protection setup. See how this compares to single-spin lottery tools. View the official 2026 NBA Draft Lottery results.